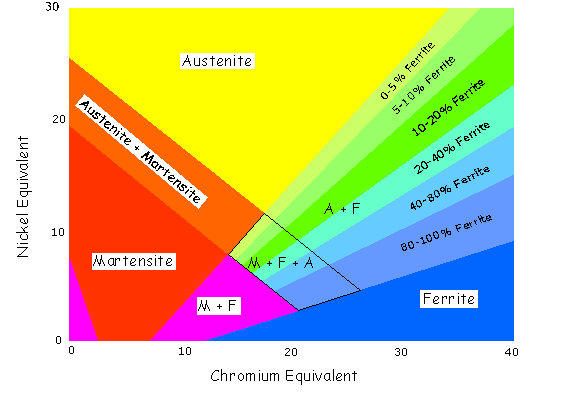
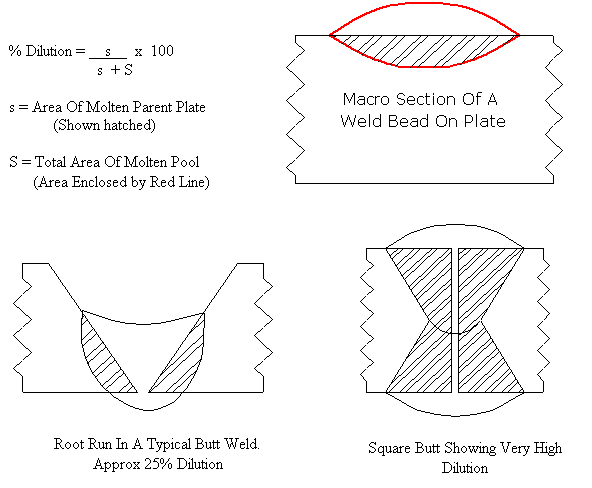
When a weld is made using a filler wire or consumable, there is a mixture in the weld consisting of approximately 20% parent metal and 80% filler metal alloy ( percentage depends on welding process, type of joint and welding parameters). Any reduction in alloy content of 304 / 316 type austenitics is likely to cause the formation of matensite on cooling. This could lead to cracking problems and poor ductility. To avoid this problem an overalloyed filler metal is used, such as a 309, which should still form austenite on cooling providing dilution is not excessive. The Shaeffler diagram can be used to determine the type of microstructure that can be expected when a filler metal and parent metal of differing compositions are mixed together in a weld. The Shaeffler Diagram
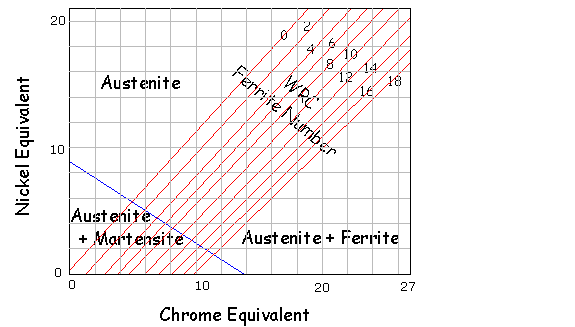
Nickel Equivalent = %Ni + 30%C + 0.5%Mn Chrome Equivalent = %Cr + Mo + 1.5%Si + 0.5%Nb Example, a typical 304L = 18.2%Cr, 10.1%Ni, 1.2%Mn, 0.4%Si, 0.02%C Ni Equiv = 10.1 + 30 x 0.02 + 0.5 x 1.2 = 11.3 A typical 309L welding consumable Ni Equiv = 14.35, Cr Equiv = 24.9 The main disadvantage with this diagram is that it does not represent Nitrogen, which is a very strong Austenite former. Ferrite Number
Examples
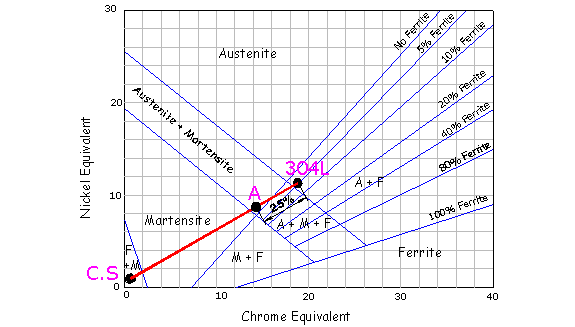
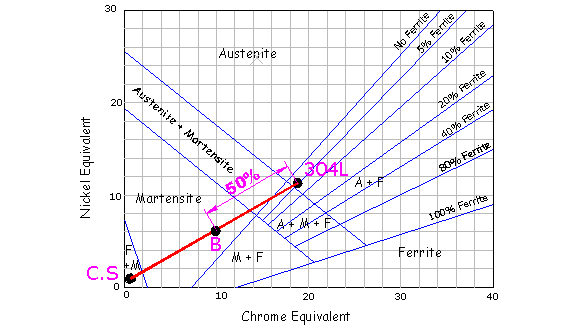
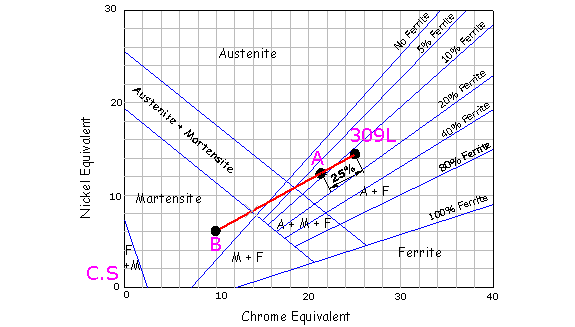
The Shaeffler diagram above illustrates a carbon steel C.S , welded with 304L filler. Point A represents the anticipated composition of the weld metal, if it consists of a mixture of filler metal and 25% parent metal. This diluted weld, according to the diagram, will contain martensite. This problem can be overcome if a higher alloyed filler is used, such as a 309L, which has a higher nickel and chrome equivalent that will tend to pull point A into the austenite region. If the welds molten pool spans two different metals the process
becomes more complicated. First plot both parent metals on the shaeffler
diagram and connect them with a line. If both parent metals are diluted
by the same amount, plot a false point B on the diagram midway between
them. (Point B represents the microstructure of the weld if no filler
metal was applied.)
Next, plot the consumable on the diagram, which for this example
is a 309L. Draw a line from this point to false point B and
mark a point A along its length equivalent to the total weld dilution.
This point will give the approximate microstructure of the weld metal. The
diagram below illustrates 25% total weld dilution at point A, which
predicts a good microstructure of Austenite with a little ferrite.
The presence of martensite can be detected by subjecting a macro section to a hardness survey, high hardness levels indicate martensite. Alternatively the weld can be subjected to a bend test ( a side bend is required by the ASME code for corrosion resistant overlays), any martensite present will tend to cause the test piece to break rather than bend. However the presence of martensite is unlikely to cause hydrogen
cracking, as any hydrogen evolved during the welding process will be absorbed
by the austenitic filler metal. Evaluating Dilution
Last Modified 19 Jan 2004 |
